Showing posts with label testing. Show all posts

Friday, 28 February 2025

Transponder Coil Test

Introduction 
This short post details the testing of the transponder portion of the tank circuit used for the ScioSense AS3935 lightning sensor.

AS3935 Block Diagram (Courtesy Sciosense B.V.)

Sensor Board for Arduino (Educational)
A printed circuit board (PCB) was designed for the ScioSense lightning sensor which was paired with an RGB LED (8x8) matrix as a visual output device for lightning intensity. The PCB design uses the common Arduino shield footprint to suit a controller such as the Uno or another compatible controller.
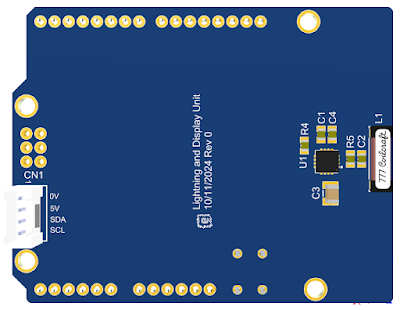
3D View of Lightning Sensor PCB

Tank Circuit Testing
After reading comments from several forums regarding sensitivity concerns with the AS3935, I wanted to check the Q-factor of the recommended LC resonant tank circuit for lighting detection. The transponder manufacturer, Coilcraft, has an article describing testing with a Helmholtz coil however I was interested in driving the recommended tank circuit with the function generator and then measuring the resonance with a second transponder coil connected to a scope.

Coil Coupled Tank Circuit Measurements
Using the two-board setup as pictured below meant that the distance and alignment of each board (transponder coils) affected the measurements. The placement of the transponders in proximity to each other impacts the field coupling. Field coupling is explained well at this Electronics Tutorials site.

Tank Circuit and Transponder Measurement Test Setup

During the test setup, the highest coupled transponder voltage on the receiver transponder was measured using an oscilloscope. The two boards were fixed in position for consistent measurements. Measurements using this test process are not perfect because of the coupling factor between the coils (not unity) and mutual inductance can also affect measurement accuracy.


Tank Circuit Measurements
The datasheet for the AS3935 recommends a 10 k resistor in parallel with a 1 nF capacitor and the transponder coil for the tank circuit.

Schematic of Tank Circuit on Test Board

A second board with only the transponder coil fitted served as the detector through a connection to an oscilloscope. 

The signal generator frequency was varied and measurements were taken using an oscilloscope. The approximate centre frequency (resonant) and the corresponding 3 dB points were determined during testing. 

From the centre frequency measurements and the 3 dB points, the Q factor was calculated. Three different resistor values were tested and the table below shows a plot of the resistor values and the calculated Q factors. For the recommended tank circuit, the resonant frequency was around 494 kHz.

Tank Circuit - Measurement Data

Tank Circuit - Plot of Resistor Value vs Q-Factor

As a validation test, the FFT function on an oscilloscope was used to view the changes in the resonant frequency of the tank circuit as the the signal generator frequency was varied.

Tank Circuit Measurement Validation using Field Probe

To perform the FFT measurements, a near-field probe (Beehive Electronics) was connected to a wideband amplifier and then connected through to an oscilloscope. 

Captured in the image below is the approximate resonant frequency of 488 kHz. The test board was fitted with the suggested design, a 10 k resistor, 1 nF capacitor in parallel with the transponder coil.

Tank Circuit - FFT Measurement

Final Thoughts
A standalone transponder coil was used in this post to show that a parallel RLC circuit on a different circuit board was resonating. Validation of the resonant frequency using a field probe indicated that the measurement difference between using a second transponder coil for measurement, or a field probe was less than 2 %. For accurate resonant frequency measurements, factors such as mutual inductance in the measurement device and the equipment under test should be accounted for.

Thursday, 6 September 2018

Surface Pro (2018) for Embedded Software Development

Summary
This blog examines the feasibility of using the Surface Pro 2018 'Surface' as an alternative to a Windows based laptop or desktop machine for the purpose of embedded software development.

Consideration was given to targeted metrics which consisted of physical handling, connectivity, storage speed and keyboard solutions. For a performance comparison, two common software packages were used to compile example projects on the Surface and a reference Asus laptop. Metrics dependent on factors which were difficult to verify, such as battery life, were not examined.


Surface Pro i5
Surface Pro i5
Testing was performed on a Surface Pro i5 over the duration four weeks, with the default Windows 10 Professional installation.


Surface Pro Hardware

The Surface Pro i5 uses the Intel 7300U processor and was loaded with 8GB of RAM running Windows 10 Professional.


Surface Pro Windows Version

Handling and Portability
As a desktop replacement, without the addition of a keyboard such as the Surface Type, the Surface Pro 'Surface' is a befitting of the name space saver. Notably for small benches or work spaces the footprint of the Surface is very appealing which makes shifting or repositioning the Surface comparably easy moving from a laptop.

Off the bench in general use, the low weight of the Surface results in relative ease of movement. The kickstand was adjusted in the same manner a laptop display would be moved to cater for varying locations or seated positions.


Bluetooth
During point and select operation during code changes, use the Surface Pen was used without any issue. Other Bluetooth devices in the same proximity to the Surface did not cause any interference. 

Wireless
The wireless maintained connection whether at short distances (1m) or longer distances (30m) from a wireless router (BiPac). Only one dropout was noted during the test period.

Wi-Fi Bandwidth testing was performed using a local server, albeit slow. The Surface and Asus devices were both loaded with IPerf 3.1.3, then several tests conducted. Tests were conducted using the bidirectional configuration in IPerf.

SO_SNDBUF is 212992
[  4] local x.x.x.x port 56795 connected to y.y.y.y port 5201
[ ID] Interval           Transfer     Bandwidth
[  4]   0.00-1.00   sec  18.8 MBytes   157 Mbits/sec
[  4]   1.00-2.00   sec  15.8 MBytes   132 Mbits/sec
[  4]   2.00-3.00   sec  12.8 MBytes   107 Mbits/sec
[  4]   3.00-4.00   sec  11.5 MBytes  96.2 Mbits/sec
[  4]   4.00-5.00   sec  10.8 MBytes  90.4 Mbits/sec
[  4]   5.00-6.00   sec  10.0 MBytes  83.7 Mbits/sec
[  4]   6.00-7.00   sec  11.6 MBytes  97.6 Mbits/sec
[  4]   7.00-8.00   sec  11.0 MBytes  92.3 Mbits/sec

[  4]   8.00-9.00   sec  10.8 MBytes  90.1 Mbits/sec

Shown below are the results of the bandwidth tests conducted.


Surface Pro vs Asus Wi-Fi Bandwidth Results
USB
The Surface's single port USB connection could certainly be considered a limitation for a embedded software or hardware developer who may need two or more USB ports.

During development the single Surface USB port was connected to a USB hub which facilitated a mouse, keyboard and programming adaptor. In some instances a serial adaptor was required. There were no issues relating to the download of drivers, operation of the USB or the performance of the adaptors.


Storage
For copying medium sized (>500Mb) files between computers either, an SD card or USB drive was used. With a meagre 128 Gb internal SSD, the removable SD card was used to store working files and backups.

The USB port was usually broken out to a hub, consequently little commentary on use with insertion of various USB equipment.

Inserting and removing the SD card from the Surface was seamless. The location of the SD slot behind the kickstand resonated with me for typical operation. 

For comparison of copy speeds for the SD card, an Asus i7-77HQ provided results as a reference device.

SD Speed
SD Card testing was performed with a Strontium Nitro 433X Class 10 16 Gb SD using the test software H2testw 1.4. This package was selected because it was capable of testing SD and USB.


Strontium Nitro 433X
Several tests were conducted using the Strontium Nitro on the Surface and Asus with the results displayed below.


Surface Pro vs Asus SD Card Read Speeds


Surface Pro vs Asus SD Card Write Speeds
USB Speed
Speed testing was performed with a Silicon Power USB 3 32GB drive using the same test software, H2testw 1.4, that was used with the SD card.


Silicon Power USB 3 Drive
Again several tests were conducted using the Silicon Power USB on the Surface and Asus with the results displayed below.


Surface Pro vs Asus USB Drive Read Speeds
Surface Pro vs Asus USB Drive Write Speeds
Software Compile Times
The first application used for comparing software compile times was the 'Maker' popular Arduino, version 1.8.6.

Arduino
Three example projects were built on the Surface and an Asus laptop. Timing of the compile process was performed manually therefore some tolerance in timing shall be noted.


Surface Pro vs Asus Arduino Project Compile Times
PSoC Creator
Again three example projects provided by Cypress were built on the Surface and an Asus laptop using PSoC Creator 4.2 'IDE'. Timing of the compile process was taken from the start and end times noted in the IDE output window.


Surface Pro vs Asus PSoC Creator Project Compile Times
Code Editing
Editing code with an application such as PSoC Creator, utilising the on-screen Surface keyboard was more cumbersome compared to a standard mechanical keyboard. One of the primary reasons was the standard Surface keyboard on-screen layout results in additional key presses to realise straightforward characters. For instance, at worst case, curly, round or square brackets would require three button presses.
A further reason for using a Surface Keyboard or a similar external keyboard solution was the on-screen keyboard does not display when text areas are clicked for editing. The on-screen keyboard had to be invoked manually.


Silicon Labs PSoC Creator Project on Surface Pro
On-Screen Keyboard
There were some initial complications with phantom presses. Applying the Microsoft HotFix for Surface Pro 4 resolved this issue.

Using the Surface Pro in landscape mode was personally the preferred option when writing code because the rear stand was used in the lowest position. Typing with the Surface flat on the desk was achievable although did not suit my office layout. The above image shows typically the ratio of code to keyboard that was used while developing the Silicon Labs blog.

Surface Pen
For specific editing tasks such as selection of text, repositioning selected text or moving on-screen objects the Surface Pen is a handy tool however, a standard external mouse will achieve the same result. People using the Surface Pen for more advanced tasks may have different feedback on its suitability.

Microsoft Surface Cover (Keyboard)
As a keyboard solution, the Surface Cover was more than reasonable with the depth of keystrokes sufficient to provide tactile feedback. The backlight keys on the Surface Cover were handy when typing whilst in low lighting conditions.


Surface Pro with Surface Cover
Final Thoughts
For embedded software development the Surface Pro is a worthy competitor to devices with similar specifications and features already in the market. 

In this setting, pro's for the Surface were the lightweight, fan less design, ease in handling and a solid Wi-Fi performance.

Unsurprisingly con's for the Surface related to limited connectivity resulting from the single USB port, throttled processor performance and initial phantom touch screen issues. The latter touch issue being the most obstructive as this phenomenon prevented device useability to the point of preventing logging onto the Operating System.

In a nutshell choosing the most suitable device ultimately depends on the requirements of the end user. Certainly for embedded software development other devices such as the middle to high end Lenovo Yoga, Dell Inspiron 13 or the HP Spectre may be a more suitable solution.


Tuesday, 22 May 2018

Delta (AFB1212SHE) Fan Testing

Summary
This blog covers some basic measurements of the Delta (AFB1212SHE) DC brushless fan with a possible use of the fan for computer cooling.


Delta AF1212SHE DC Brushless Fan
Hardware Setup
To perform measurements of the current drawn by the fan across and a range of input voltages, the displayed values on from a Rigol DP832 power supply were utilised. For the tacho measurements a Cypress CY8CKIT-049 development board was employed to convert the tacho output from the Delta fan into a corresponding RPM value.


CY8CKIT-049 - Courtesy Cypress Semiconductor


For the PSoC input a pullup resistor (4k7) was connected between the 5V DC supply and the input pin.


PSoC - Delta AFB1212SHE Test Bed
PSoC Tacho Measurement
The tacho measurement solution utilised a one second sampling window to count the number of pulses. While the measurement solution does have some level of jitter, this was unimportant as the measurement was for indicative purposes.


PSoC Tacho Measurement

The website documentation for the Delta brushless fan, AFB1212SHE-F00 shows that the fan has 4 poles and two pulses are seen for each complete rotation of the fan. The image below is taken from the fan datasheet.


Delta AFB1212SHE Tacho Output

The Cypress Timer_3 component performs all the counting and is configured to count on rising edges. A copy of the project is available at the end of the blog for anyone wanting to review and improve the design.


PSoC tacho Timer Component Configuration

Measurement results of the fan speed were made available on the Kitprog serial connection. 

Measurement Results

While varying the input voltage across the operating range listed on the Delta website, the fan speed was calculated and output to a serial monitor. The DC power consumption was calculated and plotted against the fan speed. 

Shown in the graph below is the almost linear relationship between input voltage and fan speed.


Delta AFB1212SHE Input Voltage vs Fan Speed and Power Consumption

The data listed below represents the points in the graph above. There is also one addition to the table which is Measured RPM. This value was derived using the period of the Tacho waveform to verify the error in the PSoC software measurement.


Measurements with Delta AFB1212SHE

Sunday, 19 March 2017

Testing PC Computer Fans, Cooler Master, with Multimeter or Oscilloscope (A12025012CB-3BN-F1)

Summary
Cooler Master towers have usually been my computer case of choice for several years. The latest tower used four removable SSD's in the top bay using an Icy Doc adaptor with a separate four Western Digital red drives in RAID for mass storage. Needless to say on occasions the drives in the tower generated some heat which required the three Cooler Master internal fans for some airflow!


N300 Cooler Master Case
N300 Cooler Master Mid Tower Case

Cooler Master Fan Type
Shipped with the Cooler Master tower were three 120mm fans - A12025012CB-3BN-F1. Spinning at 1200RPM the fans were not particularly noisy so when one or two failed for different reasons this was initially not recognised. For those running Linux (Ubuntu in this box) lm-sensors is strongly recommended to prevent such issues.

Fan Testing Digital Multimeter
After removing the fans the 3 pin connector was verified using site All Pinouts


Cooler Master Fans
Cooler Master Fans
As described, on the All Pinouts site, the connections were:
  1. 0VDC
  2. 12VDC
  3. Tacho
Power was connected to both fans pin 1 and 2. A Digital Multimeter 'DMM' with a frequency function was used to measure the tacho output. This measurement was performed between the tacho output and 0VDC with a 220k pullup resistor fitted between the tacho output and 12VDC. 

DMM Measuring Fan Tacho

The second fan did not register any frequency.

Fan Testing Oscilloscope
Using an Oscillscope whether top of the range Yokogowa, or a pocket SeedStudio device, to sight a waveform, regardless of the novelty of the signal, can yield useful information that a traditional DMM cannot provide.

Below are the two captures of the tacho outputs for each fan.

Cooler Master Fan 1
Cooler Master Fan 1

Cooler Master Fan 2
Cooler Master Fan 2
From the two captures shown above, fan 1 was running below its rated speed and the tacho output on fan 2 appeared to be damaged. Both fans were replaced with a newer model, as shown below.

Cooler Master Replacement Fan
As a reference, the same pullup resistor was fitted to the tacho output of the new fan, with expected results shown below.


Cooler Master Replacement Fan Tacho Output
Summary
Diagnosing a faulty fan can be achieved with the requisite hardware support on a PC motherboard and a suitable application, a DMM with frequency input or an oscilloscope of some variety. All methods provide diagnostic methods for fans with tacho feedback.