Showing posts with label measurements. Show all posts

Sunday, 31 December 2023

Oscilloscope - Ringing on Waveform Measurements

Introduction
This post is an aide-mémoire for enthusiasts performing measurements using an oscilloscope on circuits that feature fast rise-fall times.

Oscilloscope Measurement Ringing

Background
While reviewing waveforms posted online for Time Domain Reflectometry (TDR) circuits, some waveforms appeared to have ringing that may be a result of excessive lead lengths used during oscilloscope measurements.

Measurements
In this post, the example the rising edge of waveforms were captured using test equipment consisting of a 300 MHz 2 GS digital oscilloscope, a passive probe (calibrated) and a PSoC5 LP for signal edge pulse generation. The PSoC5 output pin was clocked at 4 MHz with a rise time of over 10 ns
(Infineon-AN72382_Using_PSoC_3_and_PSoC_5LP_GPIO_Pins-ApplicationNotes-v09_00-EN.pdf, Greg Reynolds, Cypress, Rev H, 2018).

In the subsequent section, example 1 was the worst-case measurement for signal ringing and example 4 was an improved setup and measurement.

Example 1. Long Lead from Probe Tip and Long Earth Connection

Example 1 - Connections for Measurement

In this example, the cable lengths connected to the oscilloscope probe contribute mostly to the signal ringing. Other factors such as impedance mismatch were not reviewed as part of this post.

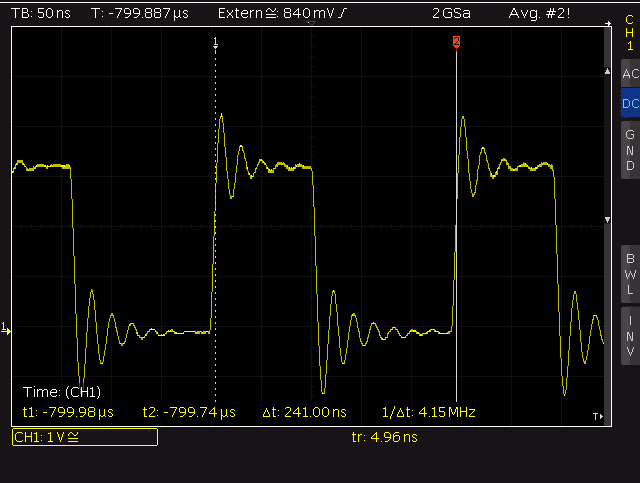
Example 1 - Oscilloscope Measurement

Example 2. Long Lead from Probe Tip and Leaded Oscilloscope Earth Connection

Example 2 - Connections for Measurement

Shorter cable lengths reduced the ringing however ringing was still prevalent.

Example 2 - Oscilloscope Measurement

Example 3. Direct Connection to Probe Tip and Leaded Oscilloscope Earth Connection

Example 3 - Connections for Measurement

This change to the connections was the largest improvement compared to examples 1 and 2. Ringing was improved with a direct probe connection and a shorter Earth lead although the return path through Earth lead could be reduced further.

Example 3 - Oscilloscope Measurement

Example 4. Direct Probe Tip and Ground Spring Connection

Example 4 - Connections for Measurement
 
A further improvement compared to example 3 with minimal lead lengths.

Example 4 - Oscilloscope Measurement

Example 5. Long Measurement Trace and Oscilloscope Earth Connection (Slow Edge Rate)

The capture below was made from the same hardware setup as example 1 and the PSoC was programmed for a slow instead of a fast edge rate.

Example 5 - Oscilloscope Measurement

Direct Connections
If a direct connection to a circuit board is possible, a board-mounted fixture in an option. These fixtures allow the oscilloscope probe tip to be inserted directly into the fixture. Some examples of fixtures for probing can be sourced from suppliers such as Teledyne, Cinch and Tektronix.

Example of Circuit Board Fixture (Courtesy Digikey)
Example of Circuit Board Fixture (Courtesy DigiKey)

Summary
Attention to measurement techniques can improve oscilloscope measurements however these are not always practical. While this post touches on one possible change that can be made to measurements, other factors should also be researched and considered depending on the type of signal. Further literature and content including passive probe compensation is available from manufacturers such as Teledyne. Detailed content for oscilloscope measurements can be found from Analog.

Saturday, 30 September 2023

Piezo Transducer Testing

Introduction 
This blog shows a piezo transducer's audible response to square waves. Measurements were performed using the software Friture with an external microphone.

Piezo Transducer
Piezo Transducer

Background
Following an incorrect delivery of a piezo transducer instead of a piezo sounder, it was fascinating to determine how the device would respond different frequencies.

Test Device
A piezo sounder is a device containing the piezo element and related drive circuitry. The drive circuitry generates the necessary signal to drive the piezo element at a specific frequency.
The piezo transducer (piezo element) tested in this blog was a part (ABT-414-RC) that specified the external drive at a certain frequency.

The specifications for the transducer are replicated below from the datasheet.

ABT-424-RC Transducer Specifications
ABT-414-RC Transducer Specifications

Testing
To measure the response of the transducer, a function generator was connected directly to the piezo. The function generator settings were made for a square wave at 0 - 3 V pk with a 50 % duty.

Image of Test Setup
Image of Test Setup

Measuring the transducer sound output was performed using the software package Friture. Friture is an open-source easy-to-navigate real-time audio analyser.

About Friture
About Friture

Friture was configured with the settings displayed below, A weighting for the measurements.

Friture Settings
Friture Settings

The microphone for measurement was a Thronmax MDrill One Pro configured for cardioid mode.

Measurements (dB) were performed at 50 cm instead of the usual distance of 100 cm. These measurements were indicative.

Frequencies between 1 kHz and 4 kHz were set on the function generator, with measured values taken from Friture. Pictured below are the plotted results taken at 50 cm spacing between the piezo and microphone.

Plot of Measurements vs Frequency for ABT-414-RC

The operation of the function generator was then changed from a single frequency to a sweep. Frequencies were swept between 1 kHz and 6 kHz over a period of 100 ms.

In the screen capture below from Friture, the first frequency peak at
2.4 kHz is seen first. There was a second resonant measurement at approximately 5 kHz.

Plot from Friture for ABT-414-RC Frequency Sweep

The sweep response above shows that the drive frequency for the piezo transducer can vary by a more than 100 Hz with minor reduction in output level.

Lastly, the function generator output frequency was set to 2.4 kHz. The measurement from Friture is displayed blow.

Piezo Measurement at 2.4 kHz
 
Limiting Piezo Voltage

To limit voltages seen by the driving source, a device such as a general-purpose diode is recommended across the terminals of the piezo. The two oscilloscope captures below show the effect on the waveform with and without a diode across the transducer. 

When measuring the sound level with the microphone, the difference in measurements for a frequency of 2.4 kHz was less than 2 dB with and without a diode fitted.

Waveform at Piezo Transducer

Waveform at Piezo Transducer with Parallel Diode
 
Summary

A piezo transducer can readily replace a piezo sounder however, implementation will depend on the hardware utilised to drive the piezo. Circuit protection should also be reviewed as part of the standard impact analysis.

Tuesday, 22 May 2018

Delta (AFB1212SHE) Fan Testing

Summary
This blog covers some basic measurements of the Delta (AFB1212SHE) DC brushless fan with a possible use of the fan for computer cooling.


Delta AF1212SHE DC Brushless Fan
Hardware Setup
To perform measurements of the current drawn by the fan across and a range of input voltages, the displayed values on from a Rigol DP832 power supply were utilised. For the tacho measurements a Cypress CY8CKIT-049 development board was employed to convert the tacho output from the Delta fan into a corresponding RPM value.


CY8CKIT-049 - Courtesy Cypress Semiconductor


For the PSoC input a pullup resistor (4k7) was connected between the 5V DC supply and the input pin.


PSoC - Delta AFB1212SHE Test Bed
PSoC Tacho Measurement
The tacho measurement solution utilised a one second sampling window to count the number of pulses. While the measurement solution does have some level of jitter, this was unimportant as the measurement was for indicative purposes.


PSoC Tacho Measurement

The website documentation for the Delta brushless fan, AFB1212SHE-F00 shows that the fan has 4 poles and two pulses are seen for each complete rotation of the fan. The image below is taken from the fan datasheet.


Delta AFB1212SHE Tacho Output

The Cypress Timer_3 component performs all the counting and is configured to count on rising edges. A copy of the project is available at the end of the blog for anyone wanting to review and improve the design.


PSoC tacho Timer Component Configuration

Measurement results of the fan speed were made available on the Kitprog serial connection. 

Measurement Results

While varying the input voltage across the operating range listed on the Delta website, the fan speed was calculated and output to a serial monitor. The DC power consumption was calculated and plotted against the fan speed. 

Shown in the graph below is the almost linear relationship between input voltage and fan speed.


Delta AFB1212SHE Input Voltage vs Fan Speed and Power Consumption

The data listed below represents the points in the graph above. There is also one addition to the table which is Measured RPM. This value was derived using the period of the Tacho waveform to verify the error in the PSoC software measurement.


Measurements with Delta AFB1212SHE

Sunday, 26 March 2017

Noctua 120mm fan testing (NF-F12 PWM) 7 x PWM using Teensy 2.0

Summary
This blog covers the replacement of a number of Cooler Master fans with Noctua PWM fans. Both fans were 120mm in size, to fit standard PC cases. Some measurements relating to PWM and current were taken as a comparison. PWM control was performed using a Teensy 2.0 programmed using Arduino.

Cooler Master Fan
Cooler Master Fan

Fan Replacement
The Cooler Master fans (A12025-12CB-3EN-F1) used in a tower of RAID drives, mentioned in this blog, were lacking the airflow to keep the temperature of the drives below 40 degrees Celsius. Noctua fans (NF-F12 PWM) were trialled with PWM control. 

It should be noted that the Cooler Master fans are rated at 2000RPM compared to the Noctua 1500RPM.
Noctua NF-F12 PWM
Noctua NF-F12 PWM

Fan PWM Control
Since PWM fan control from the existing motherboard was not possible, a Teensy 2.0 board was utilised. This board has seven PWM outputs and libraries for Arduino were already written. Image courtesy of PJRC.


Teensy 2.0 Pinouts
Teensy 2.0 Pinouts

When using the PWM outputs on the Teensy there was a difference in the frequency between some of the PWM output frequencies due to the timers. This turned out to be of no consequence as the Noctua fans worked across a large range of PWM frequencies. Even with the PWM frequency set in the low Kilohertz no clicking or other audible noises were heard from the Noctua fan.


Teensy 2.0 with Noctua NF-F12
For the fan connections, pinouts were referenced from the site All Pinouts. Power was applied to the required two relevant power pins. A common 0VDC connected was required between the fan and the GND pin on the Teensy. 


Teensy 2.0 Close Up
Teensy 2.0 Close Up

The image above has only PWM1 connected. A series 2.2k resistor for current limiting was connected between the PWM output of the Teensy to the PWM input of the fan.

Arduino Program
To control the duty for each PWM output, a simple program was written using Arduino. The code allowed each output to be individually changed. Only basic error checking was performed in the software, something to be aware of.

From a terminal program the number of the PWM output (1 to 7) followed by the duty cycle in percent (PWM ON time) was entered with a new line (enter key) to process the change. For example:

     Set PWM 1 to 75%: 175

     Set PWM 6 to 10%: 610

     Set PWM 7 to 100%: 7100

Example of working code below.


int PWM1 = 4;    /* PWM Output 1 */
int PWM2 = 5;    /* PWM Output 2 */
int PWM3 = 9;    /* PWM Output 3 */
int PWM4 = 10;   /* PWM Output 4 */
int PWM5 = 12;   /* PWM Output 5 */
int PWM6 = 14;   /* PWM Output 6 */
int PWM7 = 15;   /* PWM Output 7 */
int PWM = 0;
int PWM_Serial = 0;
int percent = 0;
char buffer[] = {' ',' ',' ',' '};

/* Start fans at full power then run down to approx 10% */
void setup() {
      Serial.begin(115200);
      pinMode(PWM1, OUTPUT);
      pinMode(PWM2, OUTPUT);
      pinMode(PWM3, OUTPUT);
      pinMode(PWM4, OUTPUT);
      pinMode(PWM5, OUTPUT);
      pinMode(PWM6, OUTPUT);
      pinMode(PWM7, OUTPUT);
      analogWrite(PWM1, 255);
      analogWrite(PWM2, 255);
      analogWrite(PWM3, 255);
      analogWrite(PWM4, 255);
      analogWrite(PWM5, 255);
      analogWrite(PWM6, 255);
      analogWrite(PWM7, 255);
      delay(2000);
      analogWrite(PWM1, 26);
      analogWrite(PWM2, 26);
      analogWrite(PWM3, 26);
      analogWrite(PWM4, 26);
      analogWrite(PWM5, 26);
      analogWrite(PWM6, 26);
      analogWrite(PWM7, 26);
}


/* Main to parse serial commands, no error handling */
void loop() {
  if (Serial.available() >0) {
    PWM_Serial = Serial.read() - '0';
    switch (PWM_Serial) {
      case 1: PWM = PWM1; break;
      case 2: PWM = PWM2; break;
      case 3: PWM = PWM3; break;
      case 4: PWM = PWM4; break;
      case 5: PWM = PWM5; break;
      case 6: PWM = PWM6; break;
      case 7: PWM = PWM7; break;
      default: break;
    }
    while (!Serial.available());
    Serial.readBytesUntil('n', buffer, 4);
    percent = ((atoi(buffer)) * 255)/100;
    analogWrite(PWM, percent);
  }
}

The terminal application TeraTerm, was used to send the commands to the Teensy. As there was no feedback provided by the Arduino code, the actual PWM signal was monitored using an oscilloscope. The Tacho output was also connected to the oscilloscope.

Power supply current and oscilloscope frequency measurements were taken for the duty cycle range of 10% to 100%.

Measurements
To determine what current (mA) the Noctua fans would consume, the duty cycle of the PWM was varied with a single fan connected and the current measured using a multimeter.


Noctua Current vs Duty Cycle

Undoubtedly the Noctua fans Tacho output against duty cycle, as seen below, has been recorded before however for completeness this was also measured.


Noctua Tacho Output vs Duty Cycle

Measurements were performed with the PWM duty starting at 10%, as the fan stall speed occurred at a duty between 7-10%.

Cable Assemblies
As a side note, Noctua provide a number of adapter cables with the fan. These range from an extension cable, Y adapter and a Low Noise adapter. Regarding the low noise adapter the Noctua cable features what appears to be a single 82R resistor, meaning that low noise is simply a by-product of limiting the total current to the fan. The same result could be implemented by adjusting the total power to the fan.


Noctua Low Noise Adaptor
Adding the low noise adapter in series with the power supply to the Noctua fan, reduces the fan speed. The current drawn by the fan is reduced to around 40mA.


Noctua Low Noise Adapter Unsheathed

Operational Temperature
In relation to the heat generated by the fan itself, a thermal camera was used to measure the Noctua fan motor which was running at full speed in free air. After several minutes, with an ambient temperature of 24C, the temperature of the fan motor was approximately 28C.

Noctua Fan Temperature
Testing
For testing the effectiveness of the Noctua fans, the RAID system inside a server was kept running using Caffeine on Linux Mint Cinnamon. The system (RAID) did not spin the drives down.


Caffeine Package
Caffeine Package
The server was left powered and running the application Caffeine for 60min to stabilise the internal temperature without fans. The temperature of the drives was taken from the Smart data available under the Disks app. The highest drive temperature was 41C.


RAID No Cooling
No Cooling RAID Temperature
A single the Cooler Master fan was tested first. After 60min the temperature of the warmest drive was 37C.

Single Cooler Master RAID Temperature
Single Cooler Master Fan - RAID Temperature
For the second test the original fan was removed and the RAID was allowed to reach 41C again. A single Noctua fan was then tested. After 60min the temperature of the warmest drive was 38C. 

Single Noctua Fan - RAID Temperature
For the next test the Noctua fan was stopped and RAID was allowed to reach 41C again. Dual Noctua fans were tested. After 60min the temperature of the warmest drive was 32C.

Twin Noctua Fans - RAID Temperature
Three fans were tried although no difference in RAID temperature was noted when compared to two Noctua fans.

Final Thoughts
There is little doubt the Noctua NF-F12PWM fan performs extremely well, almost as well as a fan running 15% faster, for the limited tests conducted above. It shall be noted however that at the time of writing this blog, the Noctua fan was four times more expensive than a Cooler Master fan or a nearest equivalent non PWM fan. This cost may be prohibitive to some looking to move to PWM. 

Additionally if large airflow is all that is required then a fast, reliable, non-PWM fan may be the more cost effective solution. Mass air flow fans manufactured by Delta or Orion may be more suitable for some installations. Orions models such as the OD1238-12HBXJ10 have an airflow of 250CFM compared to the Noctua's 56CFM however the Orion fan has an ear drumming 69dBA, compared to the Noctua almost inaudible acoustics at 23dBA.

For alternate installations such as a media centre, bedroom computer, home cinema or similar installation were low noise is paramount, then a PWM fan would be an ideal solution.